Williams–Beuren Syndrome (WBS) is a rare, sporadically occurring microdeletion disorder caused by a 1.5 Mb deletion located in chromosome band 7q11.23. It is a complex, multisystem genetic disorder characterised by a complex phenotype of physical and behavioural attributes.
The region most commonly deleted in WBS is approximately 1.5MB and typically causes the deletion of 24 genes. This region is flanked by 320-500KB of highly repetitive sequence. The repetitive and complex nature of which makes it difficult to sequence and difficult to map. Consequently, this region contains gaps in the genomic sequence and could contain genes, pseudogenes or regulatory elements that contribute to WBS. In order to fully understand the pathology of WBS and to determine genotype to phenotype correlations, a complete and comprehensive map of the WBS region is required.
The aim of the project is to close the genomic gaps in the WBS region and characterise any genes or regulatory elements that are discovered. Taverna workflows were used to automate the time-consuming and repetitive series of analyses required to achieve this objective.
Analyses
The sequencing effort in the human genome is a continuous process. Sequencing over gapped regions is ongoing. As new sequence is produced, it can be compared to the known sequence surrounding the gaps to determine any overlap. If there are sequences with overlap, these can be investigated further to characterise genes and extend the mapped region.
This type of analysis involves the use of multiple services at multiple sites, for example, BLAST for similarity searches, GenBank to retrieve new sequence data and RepeatMasker to mask repetitive DNA sequence regions. For gene characterisation, gene finding tools need to be used, such as GenScan, followed by functional motif identification tools, such as, signalP and pscan, after potential genes have been translated into amino acid sequences.
Advantages of workflows for WBS analysis
The WBS analyses described require intensive input from the bioinformatician. Results from one analysis must be cut-and-pasted into the input for the next. Reformatting is often required between analyses, making the process time-consuming and the mundane, repetitive nature of the exercise makes it prone to human error.
Automating the WBS analyses using myGrid workflows reduces these problems. Scheduling of workflow services to run in series means that the bioinformatician is free to do other research, perhaps running other workflows, whilst the experiment is running.
The careful capture of provenance information during the experiment invocation and the ability to capture results and semantic details of experiments in the myGrid Information Model and KAVE (Knowledge Annotation and Verification of Experiments) also provide great advantages in data handling.
Results
Performing a single WBS analysis manually can take anywhere between 1 and 2 weeks. Performing the same analysis using myGrid can reduce this time to a matter of hours.
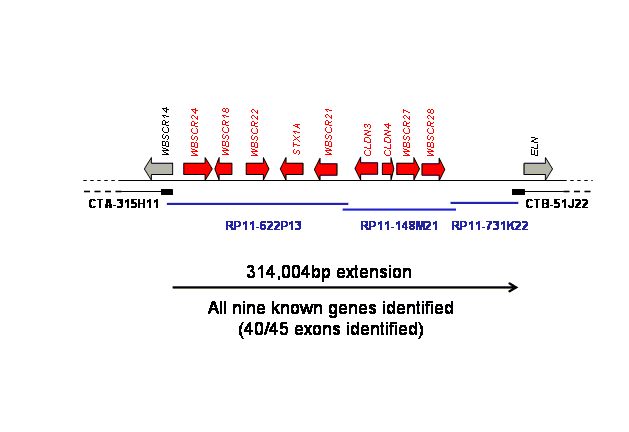
Figure below shows the results of 4 workflow cycles (approximately 10 hours). The gapped region in this case contained a complement of known genes. All were identified correctly and their relative map positions in the region were able to be determined, refining the knowledge of the WBS region.
Publications
Articles and papers about the success of Taverna for Williams-Beuren syndrome research and characterisation of genes associated with Williams-Beuren syndrome


